Mastering NotebookLM: 4 The Studio Masterclass (Part 1: Multimedia & Visuals)
NotebookLM Studio: turn your research into polished audio, video, slides, and reports in one click.
MASTERING NOTEBOOKLM
Emma Al
4/1/20265 min read
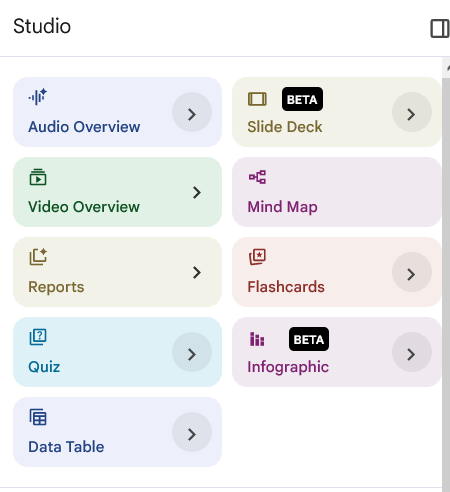
In our last article, we sent out our “AI Scouts” to gather intelligence from across the web. Now, you have a mountain of data, but how do you present it? Welcome to the NotebookLM Studio. This isn’t just a summary tool; it is a full-scale production house that transforms your raw research into professional-grade media with a single click.
Missed the series? [Part 1: Setup] | [Part 2: Managing Datasets] | [Part 3: Deep Research]
1. Audio Overviews: Your Research, Narrated
This is the “crown jewel” of NotebookLM. It creates a lifelike, two-person podcast (Deep Dive) or a focused summary where the AI hosts discuss your sources.
Customizing Your Audio: Styles & Lengths
You no longer have to settle for a “one-size-fits-all” podcast. You can now command the AI hosts to change their tone and focus depending on your goal.
1. Choose Your Format (The “Vibe”)
Deep Dive: The classic, conversational exploration. Best for a full walk through of your entire notebook.
Brief: A punchy, high-level summary. Use this when you only have 5 minutes to get the “must-know” facts.
Critique: The hosts play “devil’s advocate,” challenging your data and pointing out logical weaknesses. Best for stress-testing your own research.
Debate: The two hosts take opposing sides of a controversial topic found in your files. Perfect for understanding different perspectives on a single issue.
2. Choose Your Runtime
You can now set the clock. Whether you are walking to the office or settling in for a long drive, you can adjust the generation to Short, Default, or Long to match your schedule..
3. Prompts for Audio Hosts
You can give the hosts “marching orders” before they start talking:
General: “Focus specifically on the [Name] theory and its practical applications.”
Comparison: “List the different theories regarding [Topic] found in these files and have the hosts debate which one is most supported by the data.”
The Teacher: “Explain these concepts as if you are preparing a study session for a group of high school students.”
The Marketer: “Focus on the consumer pain points mentioned in the research and brainstorm three creative ad angles.”
The Employee: “Focus on the ‘Action Items’ and ‘Deadlines’ mentioned in these meeting transcripts so I know exactly what to do next.”
2. Video Overviews: The “Explainer” Revolution
A Video Overview is more than just a summary; it is a narrated presentation where the AI matches its “teaching style” to a specific visual aesthetic. Selecting the right style is key to keeping your audience engaged.
1. The Functional Formats
Explainer: This is the “Teacher” mode. It uses a step-by-step logical flow, making it the best choice for training manuals, new software processes, or complex academic theories.
Brief: This is the “Executive” mode. It moves quickly, highlighting only the most critical data points and “bottom-line” conclusions. Perfect for a morning project update.
2. The Visual Styles (The “Vibe”)
Classic: The professional standard. Clean, modern, and corporate. Best for boardrooms, stakeholders, and formal reports.
Whiteboard: Mimics a hand-drawn illustration style. This is scientifically proven to improve information retention because it feels like the concept is being “built” in front of the viewer. Best for educational content.
Retro Print: A stylized, vintage look that feels like a 1950s textbook or an old newspaper. Use this for creative storytelling or historical research to give your presentation a unique personality.
Anime (18+): High-energy, vibrant, and artistic. This style completely re-imagines your data through an illustrative lens. It is restricted to users 18 and older because it utilizes advanced generative art models that require adult-level account verification.
Cyberpunk (18+): A neon-lit, futuristic aesthetic. Like the Anime style, this is for adult users looking to create high-impact, modern-feeling content for social media or tech-forward audiences.
3. More Prompts for Video
While the audio prompts work here too, video allows for more structural requests:
“Create a ‘Step-by-Step’ guide showing the implementation of the [Process] described in the documents.”
“Focus the visuals on the data tables and charts found in the PDFs to explain our Q3 growth.”
4. Specialist Tip: Matching Prompt to Style
You can use the same Prompting Catalog from Article 3 to influence your video. For example:
For a Whiteboard Explainer: Use the Explain prompt or the Analogy Generator prompt to make the drawings even more effective.
For a Classic Brief: Use the Summarize prompt to ensure the narrator only focuses on the three most important “Action Items” from your files.
3. The Slide Deck: Instant Presentations
Tired of staring at a blank PowerPoint? The Slide Deck feature takes your notebook’s “Intelligence” and formats it into a structured, visual presentation.
1. The Two Formats
Before you hit generate, you can now choose the “vibe” of your deck:
Detailed Deck: A comprehensive presentation with full text and deep details. This is perfect for sending as a standalone file that people can read on their own.
Presenter Slides: Clean, “TED-style” slides with high-impact visuals and minimal text. These are designed to support you while you speak, keeping the focus on your delivery rather than a wall of text.
2. Specialist Tips for Slides
Revision Power: If a slide isn’t quite right, you don’t have to start over. You can now use “Slide Revisions” to give the AI specific feedback, like “Make this chart bigger” or “Change this tone to be more persuasive”, and it will regenerate just that piece.
Export to PowerPoint: Once you’re happy with the draft, you can export it as a PPTX file to add your final brand touches in Microsoft PowerPoint. You can also export it as a pdf file to use it immediately.
3. Specialized Prompts for Your Role:
For the Marketer: “Generate a 5-slide ‘Presenter’ deck for a brand pitch, focusing on the consumer pain points identified in our research.”
For the Teacher: “Create a ‘Detailed’ 10-slide deck that explains the core concepts of [Topic] using a bold, instructional style for beginners.”
For the Employee: “Build a project update deck focusing on the budget risks and milestones found in the last three meeting transcripts.”
4. Briefing Reports: The Professional Intelligence Brief
If the Slide Deck is for the meeting, the Briefing Report is for the “pre-read.” This feature creates a structured, high-level document designed for executive-level understanding.
1. The “One-Click” Suggestions (The AI’s Choice)
When you first upload your sources, the AI automatically analyzes the themes and presents four specific suggestions tailored to your data.
How they work: The AI looks at your content and says, “Based on this research, a Technical FAQ or a Marketing Plan would be the most useful format.”
The Benefit: These are unique to your project. If you upload medical papers, it might suggest a “Clinical Review”; if you upload meeting notes, it might suggest a “Task List.”
2. The “Fixed” Styles (The NotebookLM Studio Templates)
The styles include Briefing Doc, Study Guide, and Blog Post. They are the standard “Artifact” templates built into the Studio panel.
Briefing Doc: A structured, high-level professional report.
Study Guide: A comprehensive learning tool with key terms and practice questions.
Blog Post: A narrative-driven draft designed for public sharing or newsletters.
3. Custom Reports (The “Create Your Own” Mode)
This is where you use the Prompting Catalog we discussed in Article 3. Instead of clicking a template, you use the “Create your own” option to define a specific structure.
Example: “Create a report that only highlights the [Points of Consensus] and [Points of Divergence] across these three sources.”
4. Prompts for Reports:
The “Gap Finder” (For Researchers): “Analyze these 20 papers and generate a research report that highlights exactly what is missing in the current literature.”
The “Action Plan” (For Managers): “Create an executive briefing that includes a 3-sentence summary, 5 key findings, and a table of ‘Recommended Actions’ based on our policy docs.”
The “Simple Explainer” (For Teachers): “Summarize these complex scientific sources into a 1-page briefing using analogies and language suitable for [Grade Level] students.”
You can export your reports to Google docs and download it from there.
What’s Coming Next? In Part 2 of the Studio Masterclass, we go into the “Artifacts”: how to create Interactive Flashcards, Interactive Quizzes, and Custom Tables to turn your research into a personal training ground.
Follow me to ensure your AI research looks as professional as it sounds!
Question for you: Would you rather listen to your research as a podcast or watch it as a whiteboard explainer? Let’s hear your preference in the comments!
Enjoyed This?
If you'd like to see practical examples and screenshots demonstrating how these tools are used in real-world scenarios, you can read the illustrated version of this article on my Substack.
https://aiportalen.substack.com/p/mastering-notebooklm-4-the-studio
AI Portalen
Follow us on social media
© 2025 AI Portalen. All rights reserved. Stockholm, Sweden.
Enter your email, and we’ll send free resources directly to your email..
By subscribing, you agree to receive the AI Portalen newsletter.
We respect your privacy. You can unsubscribe anytime.